Livestock attack maps often show patterns and clusters that suggest territorial behavior among cryptids like the chupacabra. Attack sites frequently align with natural features, prey availability, and seasonal changes, indicating possible boundaries and contested zones. Clustering and consistent hotspots support the idea of territorial disputes, but alternative explanations like habitat overlap or prey movement exist. To understand how these maps reveal cryptid behavior and disputes, you need to explore further details and analysis.
Key Takeaways
- Attack hotspots and clustering patterns indicate potential territorial boundaries of chupacabras.
- Mapping attack zones reveals whether chupacabras are territorial or nomadic behaviors.
- Seasonal and geographic attack patterns suggest territorial defense or habitat preferences.
- Attack locations often correlate with natural features like water sources, shaping territory boundaries.
- Analyzing attack maps helps understand territorial disputes and habitat overlaps among cryptids.
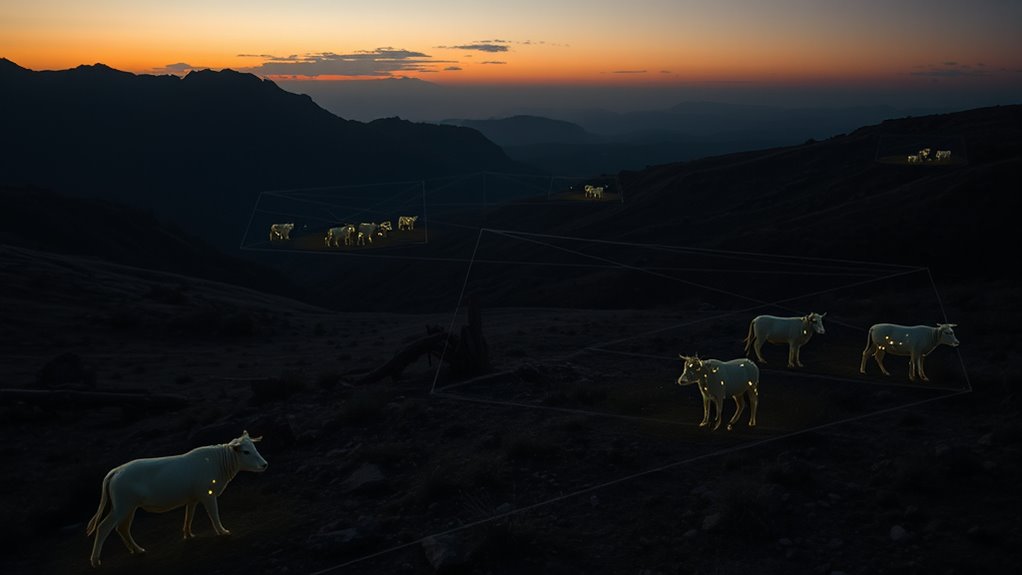
Mapping Livestock Attacks: An Overview

Mapping livestock attacks is essential for understanding the scope and pattern of chupacabra activity. By charting where attacks occur, you can identify potential hotspots and correlate them with cryptid sightings reported by locals. These sightings often tie back to folklore origins, shaping the stories and fears surrounding the creature. Tracking attack locations helps you see if there’s a consistent geographic pattern or if incidents are scattered randomly. This data provides insight into whether the chupacabra is a real creature, a myth, or a combination of both. The more detailed your maps, the better you’ll understand how folklore influences attack reports and whether certain areas are more prone to these mysterious incidents.
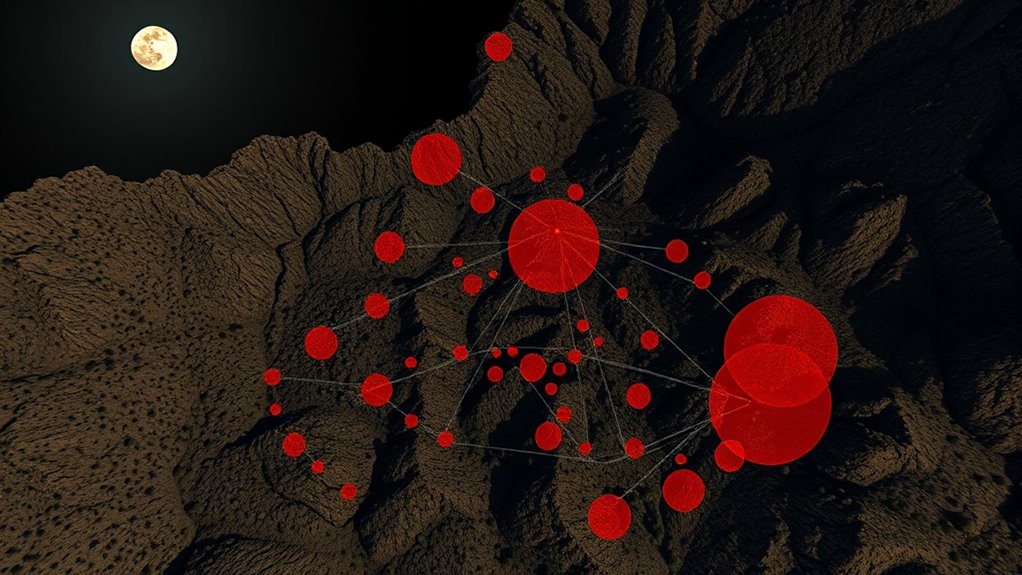
Identifying Patterns in Attack Locations

To identify patterns in attack locations, you need to analyze the geographic distribution of incidents systematically. Look for consistent hotspots where livestock attacks occur, which can reveal habitat preferences of the chupacabra. Consider factors like proximity to water sources, wooded areas, or open plains, as these influence predator activity. Predator competition might also push chupacabras into specific territories, especially where other predators are absent or less dominant. Recognizing these patterns helps you understand where chupacabras are most active and why. Key insights include:
Identifying attack hotspots reveals chupacabra habitat preferences and territorial behavior.
- Concentration near edge habitats, blending open and forested areas
- Avoidance of densely populated or highly competitive predator zones
- Preference for rural, less disturbed landscapes
- Clustering in regions with abundant prey and minimal human interference
This approach clarifies their territorial behavior and environmental preferences.
Temporal Trends and Attack Clustering
Examining the timing and clustering of chupacabra attacks reveals important patterns that can shed light on their behavior. You’ll notice attacks often cluster during specific seasons, possibly linked to seasonal migration of livestock or prey. These periods may also coincide with shifts in predator competition, as other predators become less active or move to different areas. Such temporal trends suggest chupacabras might exploit times when prey is more accessible or when competition is reduced. Clusters of attacks can also indicate periods of heightened territorial activity or resource disputes. Understanding these patterns helps you identify when chupacabras are most active and how they respond to ecological changes. Recognizing these temporal trends is key to anticipating future attacks and understanding their territorial dynamics.
Comparing Attack Zones Over Time
You’ll notice how attack zones shift over the years, revealing changes in territorial control. Patterns in attack spread show how disputes expand or contract, indicating evolving boundaries. By comparing these zones over time, you can better understand how territorial boundaries are constantly in flux.
Zone Shifts Over Years
Over the years, the attack zones attributed to the chupacabra have shifted considerably, revealing a pattern of territorial movement. This cryptid migration suggests that the creature adapts by exploring new areas, often overlapping habitats with other wildlife. Tracking these zone shifts helps you understand how environmental factors influence its movement. The following points highlight key aspects:
- Territorial expansion indicates possible competition or resource scarcity.
- Habitat overlap with native species may drive the cryptid to new regions.
- Seasonal migration patterns could explain periodic zone changes.
- Human development might push the creature into previously unoccupied territories.
These shifts reveal a dynamic territorial behavior, emphasizing that the chupacabra’s movement isn’t static but continually evolving in response to environmental and ecological pressures.
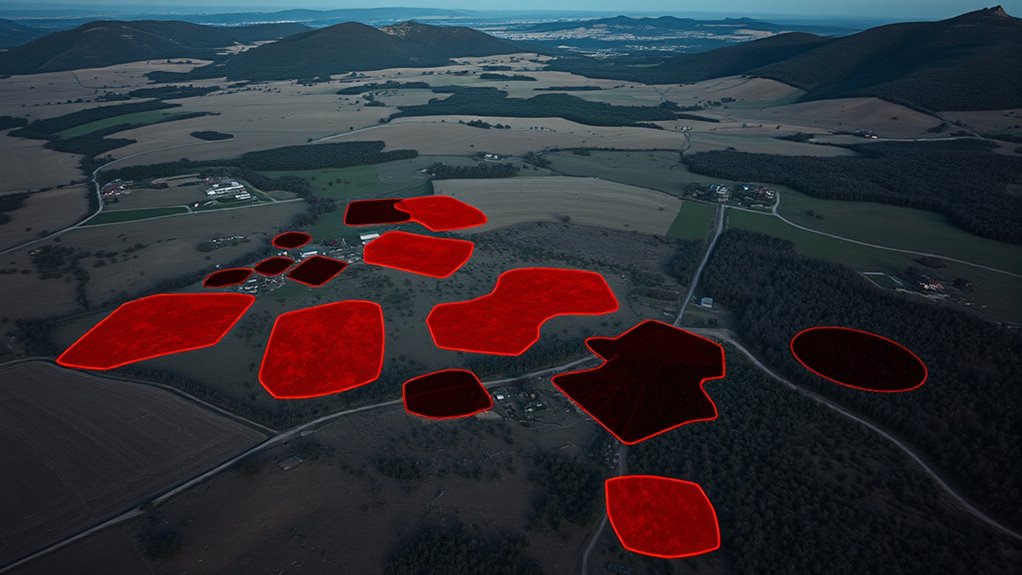
Patterns in Attack Spread
As attack zones attributed to the chupacabra have expanded and shifted over time, patterns emerge that reveal how the creature’s presence spreads across different regions. You notice attack clustering along certain territorial boundaries, indicating preferred areas. Over the years, these clusters grow denser and more widespread, suggesting an increasing influence within specific zones. The map below illustrates this trend:
| Year | Attack Clustering | Territorial Boundaries |
|---|---|---|
| 2018 | Sparse, isolated | Limited, defined |
| 2019 | Growing clusters | Expanding, shifting |
| 2020 | Dense clusters | Overlapping regions |
| 2021 | Widespread spread | Boundaries dissolving |
This pattern highlights the evolving nature of attack zones, emphasizing how the chupacabra’s influence is shifting beyond initial territorial limits.
Territorial Boundaries Evolving
The boundaries of the chupacabra’s attack zones have continually evolved, reflecting a dynamic shift in its territorial reach over time. This evolution suggests the cryptid habitat is not fixed but responsive to environmental and interspecies factors. As chupacabras expand or retreat, they may alter territorial markers, such as scent marks or defended areas, to establish new boundaries. You might notice:
- Expansion into adjacent livestock regions
- Contraction of attack zones after resource depletion
- Shifts toward less populated areas for safety
- Changes in attack frequency indicating territorial disputes
These movements demonstrate a fluid territorial landscape. Tracking attack zones over time reveals how the chupacabra adapts to maintain its territory, often reshaping the cryptid habitat and redefining its territorial markers in response to external pressures.
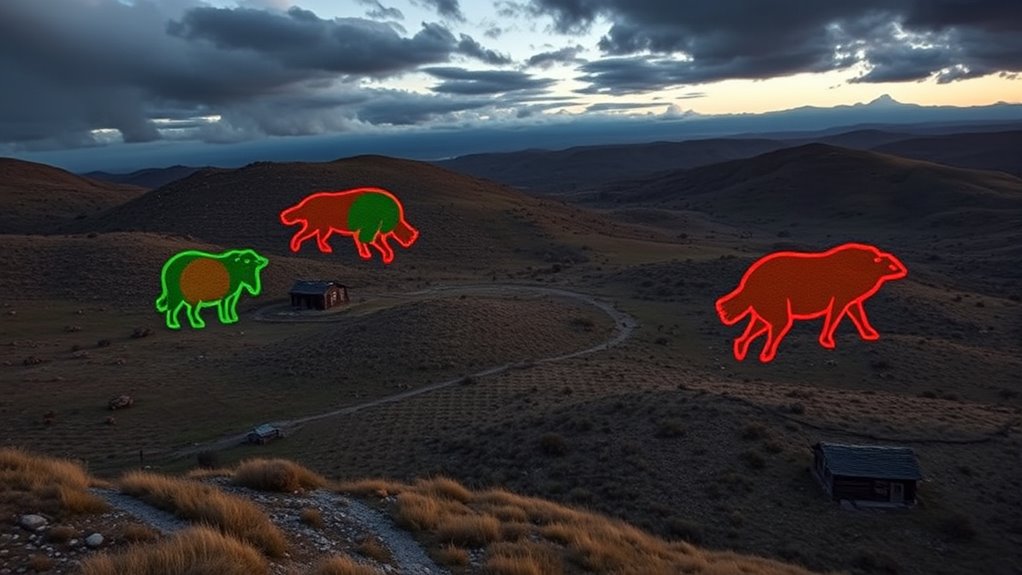
Possible Indicators of Territorial Boundaries

You can look for attack clustering patterns to identify potential boundaries, as consistent hotspots often mark territorial edges. Geographic attack variability might also reveal shifts or overlaps in territory over time. By analyzing these indicators, you get closer to understanding how chupacabras defend their claimed areas.
Attack Clustering Patterns
Attack clustering patterns can reveal important clues about the territorial boundaries of chupacabras. You’ll notice that attack hotspots often form tight groups, indicating areas they defend or prefer. These clusters suggest that chupacabras may establish specific zones, rather than roaming randomly. Recognizing these patterns helps you understand how they mark their territory and avoid overlapping with others.
Key insights include:
- Concentrated attack zones hint at territorial boundaries.
- Gaps between clusters may indicate defended borders.
- Overlapping attack hotspots suggest contested areas.
- Persistent attack locations reinforce territorial claims.
Geographic Attack Variability
Variations in attack locations across different geographic areas can serve as key clues to defining chupacabra territorial boundaries. These differences often reflect habitat preferences, with chupacabras favoring certain environments like rural, wooded, or semi-arid regions. Prey selection also influences attack patterns; in some areas, they target goats and sheep, while in others, poultry or smaller livestock predominate. Such variability suggests that territorial boundaries are shaped by resource availability and habitat suitability. By analyzing where attacks occur and correlating them with landscape features, you can identify potential territorial zones. Consistent attack patterns within specific habitats reinforce the idea that chupacabras establish territories based on environmental factors and prey preferences, helping to map their range more accurately.
Alternative Explanations for Attack Distributions
While many attribute the irregular attack patterns to the elusive nature of the chupacabra, alternative explanations suggest that environmental factors, prey availability, or human activity might influence where and when these creatures are blamed for livestock losses. These patterns often stem from misconceptions rooted in urban legends or predator misidentification. Factors such as seasonal changes, habitat disturbance, or local hunting practices can shift attack hotspots. Human activity, like increased livestock movement or farming methods, can also alter attack distribution. Recognizing these influences helps clarify why attack locations vary, moving beyond mythical creature explanations to understand real ecological and social dynamics. This perspective emphasizes how perceptions and environmental conditions shape livestock loss reports, rather than solely attributing them to a supernatural predator.
Implications for Understanding Chupacabra Behavior

Understanding the implications for chupacabra behavior requires examining how environmental and human factors influence reported sightings and attacks. You can see that territorial boundaries play a key role in shaping attack zones, often coinciding with natural features like water sources or forest edges. These boundaries suggest that chupacabras may establish specific areas they defend or utilize for hunting. Recognizing attack zones helps clarify whether these creatures have defined territories or are more nomadic. Human activity, such as livestock grazing patterns and land development, also impacts these boundaries. By analyzing livestock attack maps, you gain insights into how chupacabras might mark territory and respond to environmental changes. This understanding helps explain attack clustering and guides future research into their likely behavioral patterns.
Future Directions in Cryptozoological Mapping
Advancements in cryptozoological mapping promise to transform how you track and interpret chupacabra activity. By analyzing detailed livestock attack maps, researchers can better identify patterns related to territorial aggression and habitat preferences. Future mapping techniques will integrate real-time data, drone surveillance, and GIS technology to pinpoint high-activity zones. This approach helps clarify how chupacabras defend territories and select habitats. You’ll see more precise models that reveal movement corridors and conflict zones. These developments can improve understanding of their territorial disputes and aid in managing human-wildlife interactions.
- Improve detection of territorial boundaries
- Clarify habitat preferences and overlaps
- Track shifts in territorial aggression over time
- Develop targeted conservation or mitigation strategies
Frequently Asked Questions
How Reliable Are Livestock Attack Maps in Confirming Chupacabra Territorial Claims?
You might wonder about attack map accuracy when it comes to confirming chupacabra territorial claims. While livestock attack maps can show patterns, they often rely on livestock behavior and reported incidents, which aren’t always precise. These maps can suggest trends but aren’t foolproof for confirming chupacabra activity. Always consider other evidence, as attack maps alone may not reliably prove territorial disputes without supporting data.
What Environmental Factors Influence the Geographic Spread of Attacks?
You might notice that climate variability influences where attacks happen, as warmer, humid areas attract more prey and predators. For example, in a hypothetical case, increased rainfall expands predator habitats, leading to more attacks in certain regions. Predator presence also plays a key role; areas with abundant predators see higher attack rates. So, environmental factors like climate variability and predator presence directly shape the geographic spread of livestock attacks.
Can Attack Patterns Predict Future Chupacabra Movements?
You can use behavioral modeling and geographic forecasting to predict future chupacabra movements. By analyzing attack patterns, you identify trends and hotspots that suggest where these creatures might go next. This approach helps you anticipate their behavior, allowing for better preparedness and targeted investigations. While not foolproof, combining these methods improves your ability to forecast chupacabra activity based on past attack data and environmental factors.
How Do Livestock Attack Maps Compare With Other Cryptid Evidence?
You might think livestock attack maps are just data, but they tell a story that cryptid sightings and folklore origins often lack. While sightings spark imagination, attack maps offer tangible evidence of patterns, making them more compelling for some. Comparing these, attack maps provide measurable, geographic insights, whereas folklore emotions evoke cultural beliefs. Both add layers to understanding cryptids, yet attack maps give you a more concrete foundation for studying their potential movements and disputes.
Are There Cultural or Societal Impacts Linked to Attack Zone Perceptions?
You might notice that attack zone perceptions influence community fear and shape local myths. These zones often become symbols of mythical symbolism, reinforcing stories about creatures like the chupacabra. As a result, residents may develop heightened anxiety, distrust, or suspicion toward outsiders, fueling ongoing folklore. This dynamic shows how societal impacts stem from collective beliefs, turning livestock attacks into cultural narratives that deepen community bonds or divisions over mythical threats.
Conclusion
As you examine these attack maps, imagine the chupacabra’s shadow stretching across the landscape, hinting at unseen boundaries. By mapping where these attacks happen, you start to see a pattern—territorial whispers in the darkness. This isn’t just about livestock; it’s about understanding a creature that remains elusive. Keep exploring, for every map you study draws you closer to revealing the mystery lurking in the night’s silence.